
Description
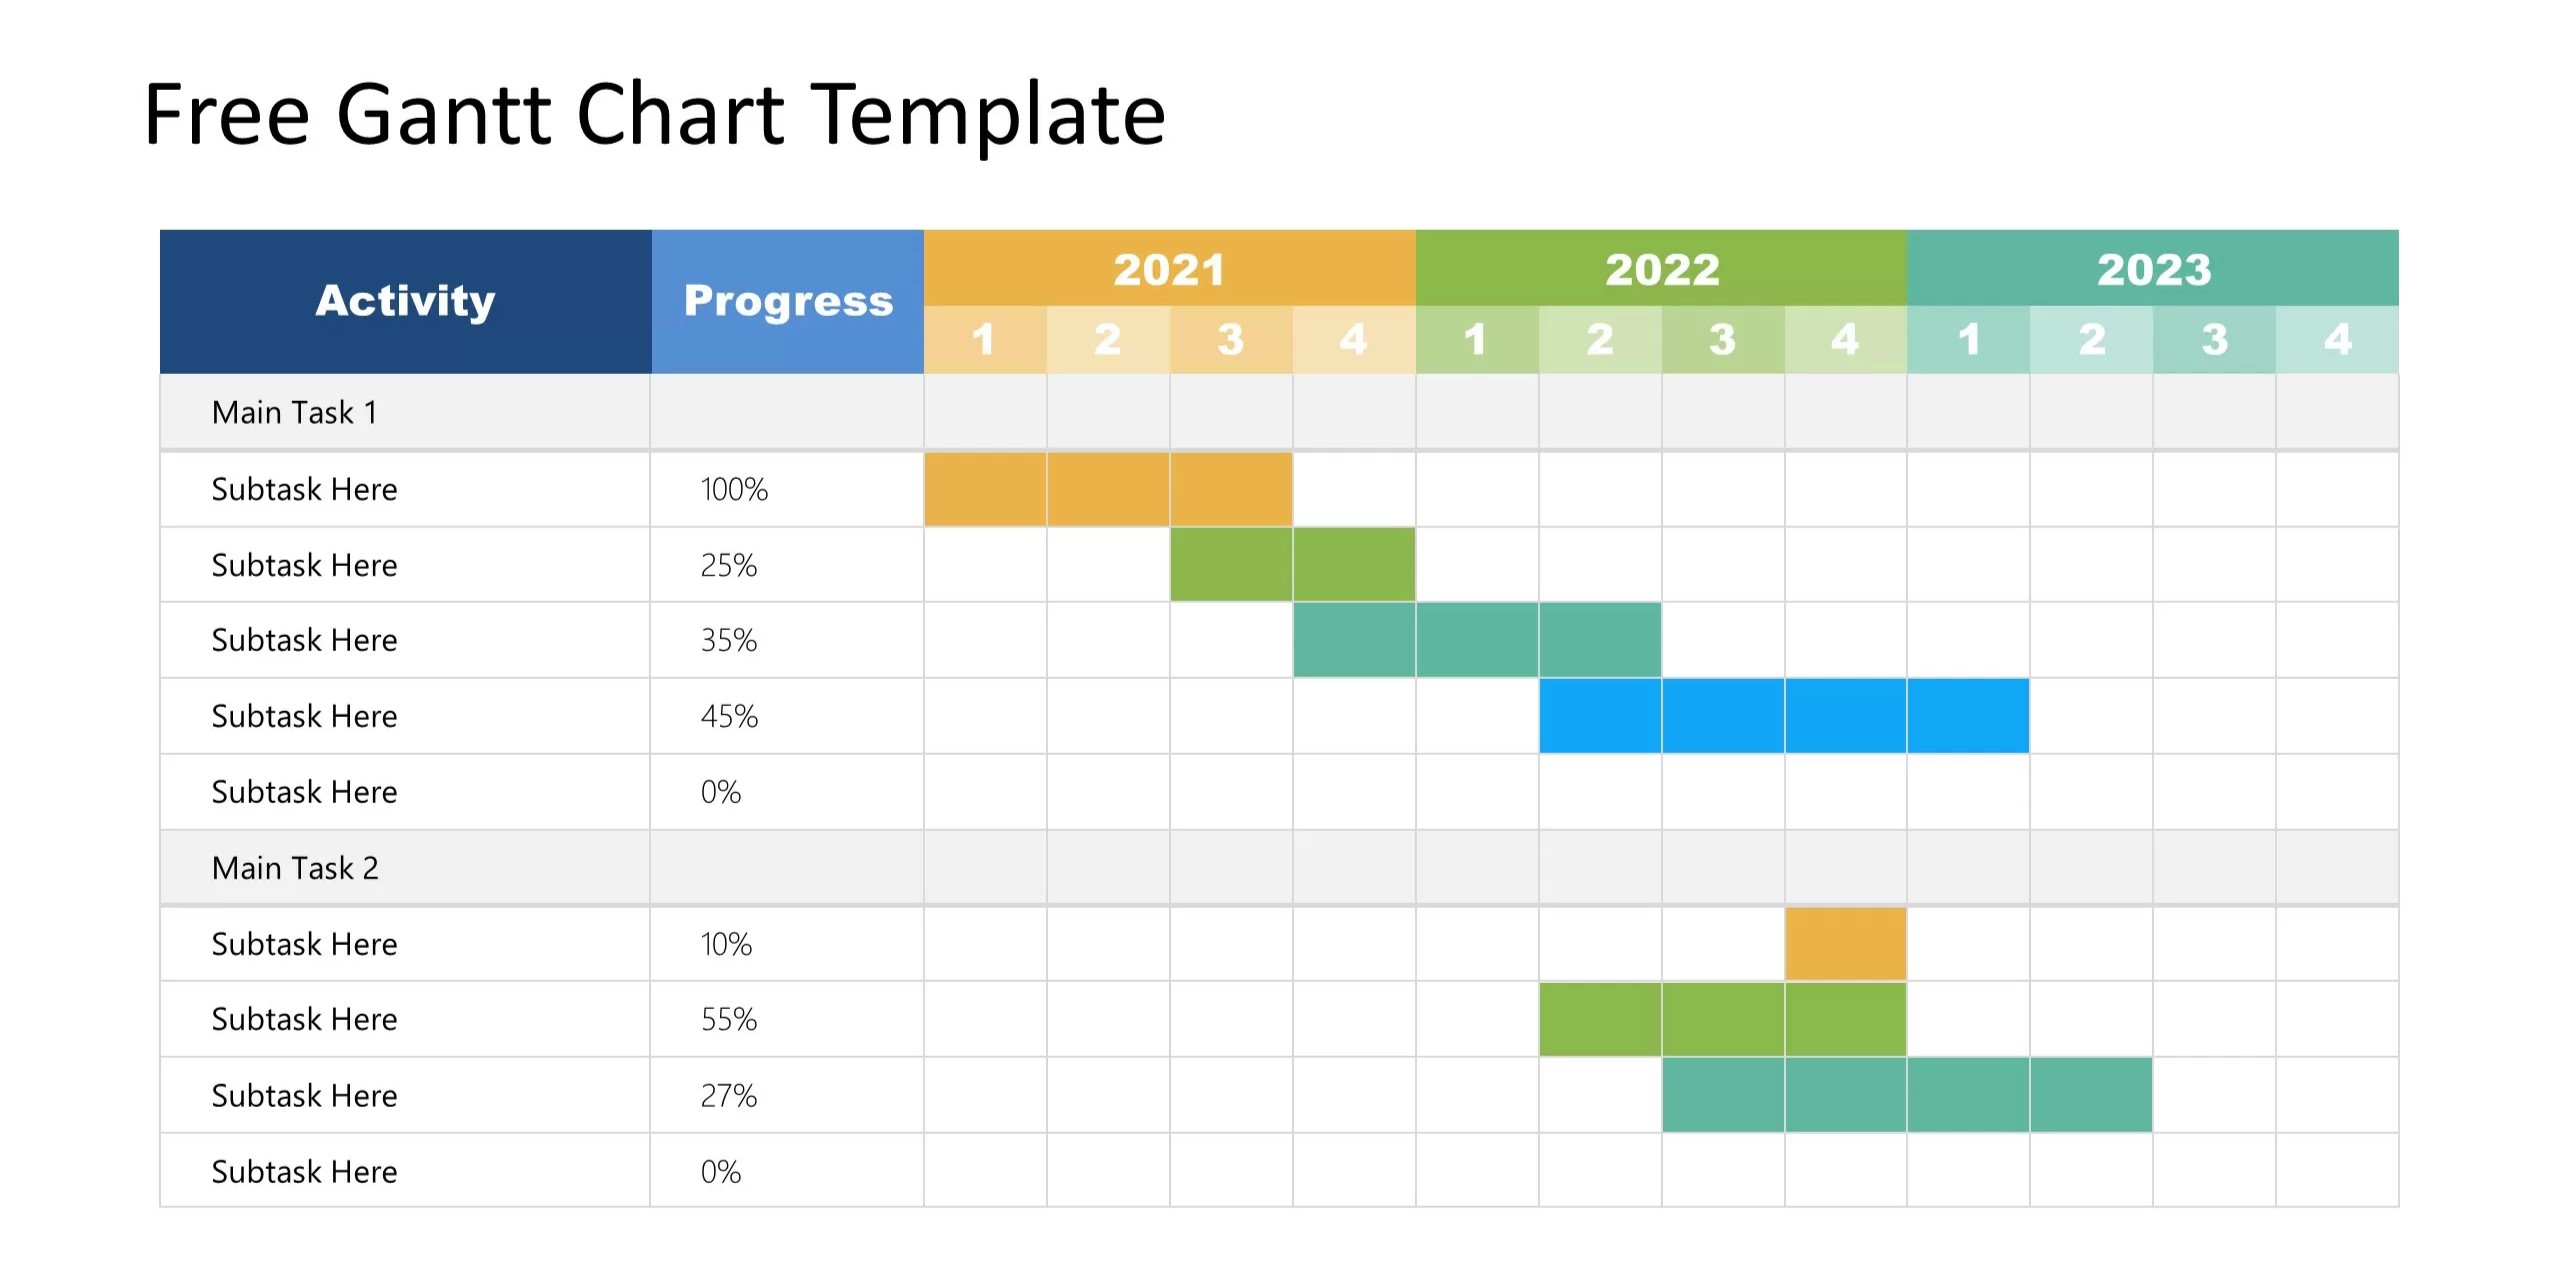
The Gantt Chart Template is a widely used project management tool that provides a visual representation of the project schedule. It consists of a horizontal bar chart where each bar represents a task, and the length of the bar indicates the task’s duration. The chart displays tasks sequentially over time, allowing project managers to see the start and end dates of each task, their durations, and any overlaps between tasks. This visualization aids in identifying dependencies between tasks, potential bottlenecks, and critical paths. The Gantt Chart Template typically includes columns for task names, start and end dates, durations, and dependencies, along with the graphical timeline. By using this template, project managers can effectively plan the project schedule, allocate resources, and monitor progress. It also serves as a communication tool, providing stakeholders with a clear overview of the project’s timeline and current status. The Gantt Chart Template is essential for ensuring that projects stay on schedule and that any delays are promptly identified and addressed.

Memunat –
As a project manager, I’ve relied heavily on this Gantt chart template to streamline my construction projects. Its intuitive design and comprehensive features have enabled me to effectively plan, schedule, and track tasks, ensuring timely completion and client satisfaction. The template’s flexibility has accommodated the varying complexities of my projects, allowing me to customize it to meet specific requirements. With its clear visual representation of the project timeline, I’ve gained greater control over resources, identified potential bottlenecks, and made informed decisions to optimize project outcomes.
Promise –
This Gantt Chart Template has been an invaluable tool for my construction project. Its intuitive design and easy customization made it effortless to create a detailed and comprehensive timeline for my project. The ability to track progress in real-time has ensured that I stay organized and avoid delays, while the visual representation has helped me communicate project status to stakeholders effectively. I highly recommend this template to anyone involved in construction management looking to streamline their planning and execution processes.
Chinyere –
This Gantt chart is an essential tool for any construction project. It provides a clear and concise overview of the project’s timeline, tasks, and dependencies. The easy-to-use interface makes it quick and easy to create and update charts, even for complex projects. The ability to export charts in multiple formats ensures compatibility with a variety of software programs, allowing seamless integration into existing workflows. Overall, this Gantt chart template is an invaluable asset for any construction professional looking to improve project planning and execution.